VirtualMetric Real-time Monitoring Suite is now supporting Dashboard Playlists, providing full visibility over your infrastructure and virtualization monitoring for your whole team. Monitoring a complex infrastructure is a hard task. We make it simple thanks to our new Dashboard and a bunch of functionalities focused on your user experience, time-saving and improving the efficiency of your team.
The key to taking all the benefits from a monitoring solution for your physical and virtual environment is having a full-featured solution, which provides also a great UX and ease of use. By avoiding the complexity you will be able to find the information you need in a second, react fast to unexpected situations and solve all issues before they emerge.
Real-time monitoring Dashboard by VirtualMetric
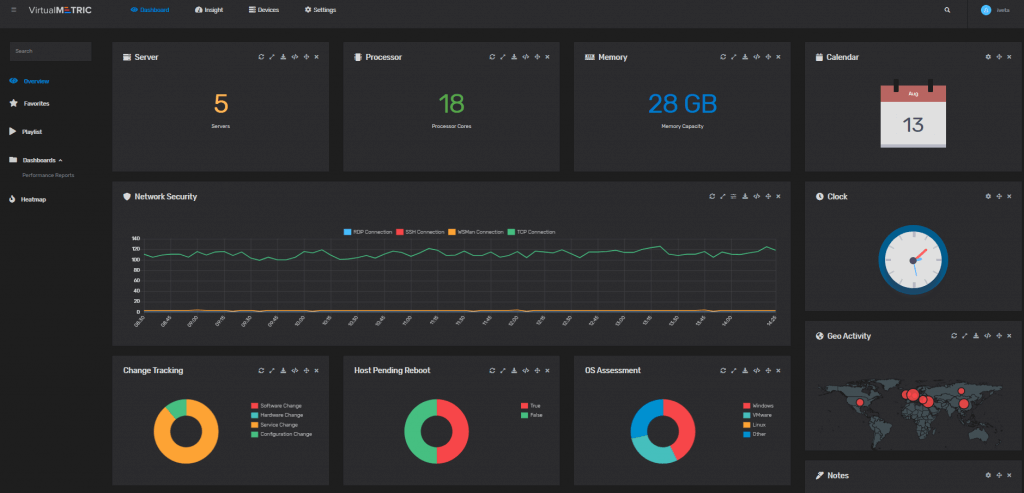
Every time you open VirtualMetric, the first thing you are going to see will be your Dashboard. The Dashboard contains all the important metrics for your infrastructure to ensure the availability of the mission-critical processes, applications, and infrastructure. We provide you with a real-time 1-second interval Dashboard, which is fully customizable. To increase the efficiency and speed of your work, you can add the most commonly used reports and charts to the Dashboard. In this way, with a single click, you will view all the metrics in real time for your servers, processors, memory, networks security, event management, virtual machines, inventory, usage, etc.
Easy share of Dashboards, export, and import of reports
Working in a big team and need to share a Dashboard? You can do it with a single click of a button in VirtualMetric. The smart monitoring solution is designed to enable you to collaborate with your colleagues in an easy and fast way. Share the custom reports from your Dashboard or the whole Dashboard with the export functionality. Enable different teams to monitor the same server groups or counters.
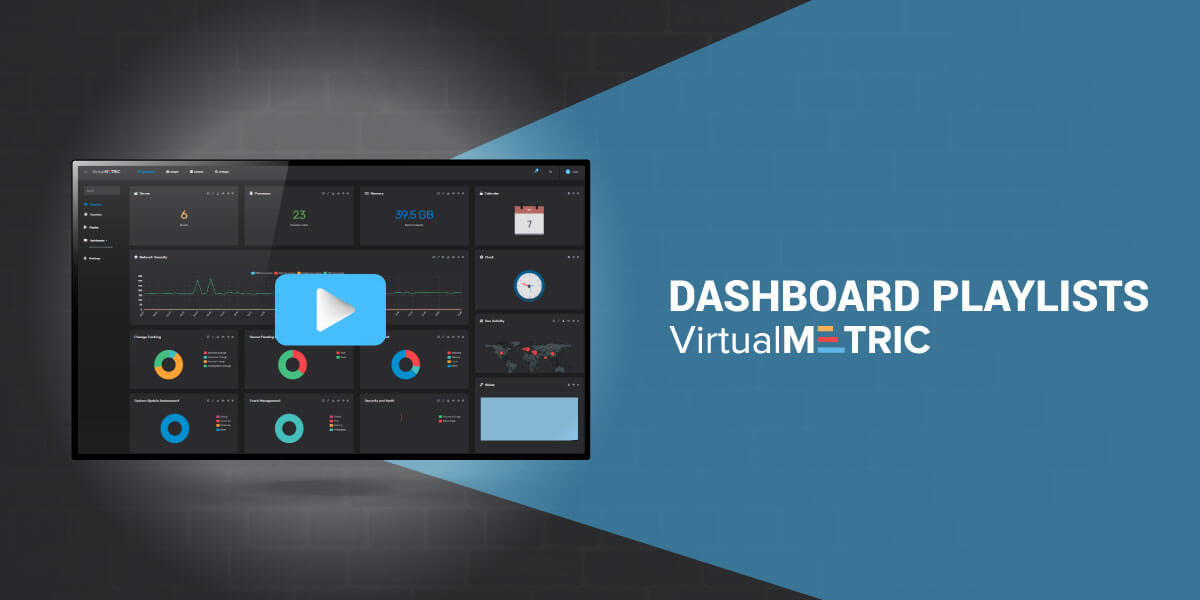
Dashboard Playlists – virtualization monitoring at a glance
The Dashboard Playlist feature allows you to automatically display the Dashboards you want in an interval of 20 seconds or 5 minutes. Play the Dashboards on a big TV in your IT department and ensure that your team can track closely all the important metrics to ensure the optimal performance and uptime of your infrastructure or to mitigate fast attacks and security breaches.
Correlate Change Tracking Stats with Server Performance Data
To ensure your infrastructure performance no doubt you need to have excellent infrastructure and virtualization monitoring solution. Constant observation of counters like disk latencies, logical core CPU usages, network dropped packages and disk IO is vital. Monitoring the critical metric will help your infrastructure and applications to perform in the best way.
What VirtualMetric is doing as an added value for you is the opportunity to correlate change tracking information with server performance data. You will be always able to understand which change is causing a performance to degrade and fix it fast.
Leave a Reply